Notes from a talk by Annette Bailey of Virginia Tech at the LITA National Forum, “Discovering Discovery.”
Virginia Tech has been a Summon customer since 2010. They have leveraged Summon to change cataloging practices locally. Still using original Summon (1.0) interface.
Library users are shifting behaviors. Increasing usage of online resources, physical spaces — but not physical resources. Discovery largely happens through Summon. How can VT know what its users are doing? COUNTER provides some information, but its delayed, and hard to process. Summon provides aggregate data on search terms and click data. How can we know what users are doing in real time? And share it with other members of the community, show visually what research is happening, live?
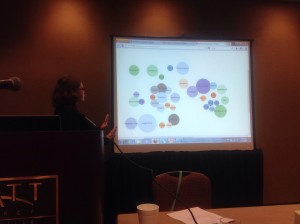 That is the heart of Discovering Discovery — what are users clicking on in Summon, in real time. Can’t tell if they use the item, but can tell that they accessed it.
This tool helps everyone — librarians, the public, students — to understand what is being done in the library. User does a search. There’s some custom JavaScript in the Summon interface that sends a record of the click to the visualization server, which stores it in a database. A visualization tool then makes a display on demand. It grabs the Summon record ID, unique for each item. They then use the Summon API to grab the metadata for that query — because Summon IDs are not persistent over the long term. All of that is stored in an SQLite database.
As a side note, they can tell how many unique items were clicked on over time — hard to do otherwise.
Current log analysis extracts and tabulates data at 1 minute, 5 minute, 1 day, 1 week intervals. Tabulates by discipline, content type, source of record, publication year. All comes from Summon, which means data are problematic. Does word frequencies for abstract, title, and abstract & title combined, and keywords & subject terms.
Use the d3.js library to do visualizations. It’s a powerful tool, but hard to work with. Follows jQuery in style. Also uses a variety of server-side technologies.
Summon 2.0 — not there yet. Unlike Summon 1.0, there is now an officially sanctioned way to include JavaScript (it’s a hack in 1.0). It now includes d3.js in Summon — they do not appear to be using it yet, but it’s there. Look out for visualizations at some point…. But they need to reverse engineer Summon 2.0 to achieve the same effect as in Summon 1.0.
Using this with other discovery services. You need to be able to record clicks, in real time. You need an API to get the machine data. If you use a different discovery service and want to try adapting this code, VT would like to work with you.
The visualization is the hard part; getting the data was the relatively easy part. Code needs to be consolidated, into a cloud solution, to make your version for your own use. (Like the Libx edition builder).


